Contour Property
Goal
- 대상의 속성으로 자주 사용되는 추가적인 속성에 대해서 알 수 있다.
Aspect Ratio
Contours Line의 가로 세로 비율 속성입니다.
\[Aspect Ratio = \frac { Width }{ Height }\]
cv2.boundingRect() 함수를 이용하여 가로/세로 크기를 구한 후에 사용합니다.:
x, y, w, h = cv2.boundingRect(cnt)
aspect_ratio = float(w)/h
Extend
Contour Line을 포함하는 사각형 면적대비 Contour의 면적 비율입니다.
\[Extend=\frac { Object\quad Area }{ Bounding\quad Rectagle\quad Area }\]
area = cv2.contourArea(cnt) # Contour Line의 면적
x, y, w, h = cv2.boundingRect(cnt)
rect_area = w * h  # 사각형 면적
extend = float(area) / rect_area
Solidity
Solidity Ratio(고형비)는 Convex hull 면적 대비 Contour의 면적 비율입니다.
\[Solidity=\frac { Contour Area }{ Convex Hull Area }\]
area = cv2.contourArea(cnt) # Contour Line면적
hull = cv2.convexHull(cnt) # Convex hull line
hull_area = cv2.contourArea(hull) # Convex hull 면적
solidity = float(area) / hull_area
Extream Points
Contour Line의 좌우상하의 끝점을 찾는 방법입니다.:
leftmost = tuple(cnt[cnt[:,:,0].argmin()][0])
rightmost = tuple(cnt[cnt[:,:,0].argmax()][0])
topmost = tuple(cnt[cnt[:,:,1].argmin()][0])
bottommost = tuple(cnt[cnt[:,:,1].argmax()][0])
cnt는 contour point가 포함된 array입니다. 여기서 cnt[:,:,0] 의 의미는 point의 x 좌표 값만 포함하는 배열이 됩니다.
여기에 argmin() 을 적용하면 x좌표가 가장 작은 array의 위치가 나오게 됩니다. 그 위치를 다시 cnt에서 찾으면 가장 왼쪽에 있는 좌표를 얻을 수 있습니다.
나머지도 동일한 방법으로 좌우상하의 끝점을 찾을 수 있습니다.
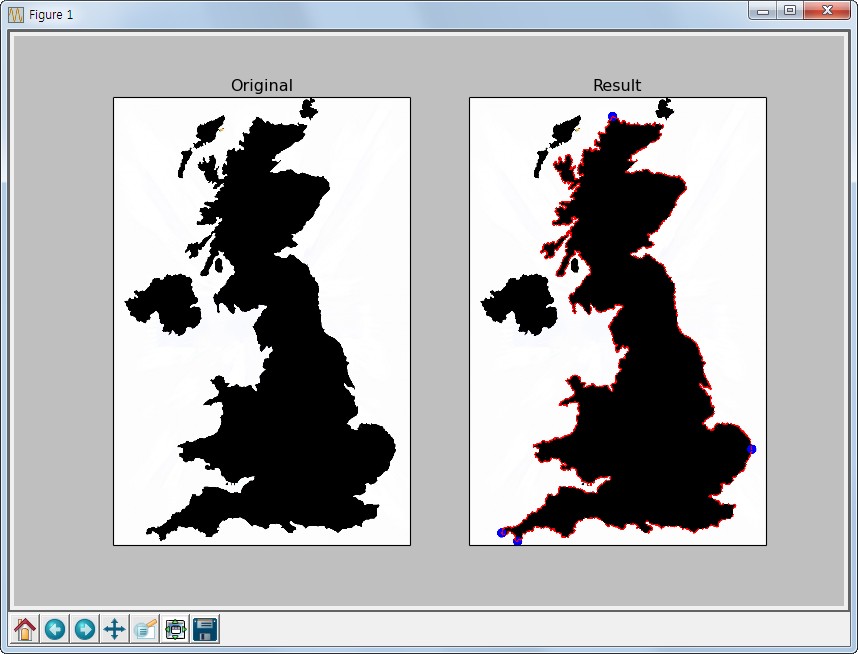
아래는 지도상에서 끝점을 찾아 표시하는 예제입니다.
Sample Code
1 2 3 4 5 6 7 8 9 10 11 12 13 14 15 16 17 18 19 20 21 22 23 24 25 26 27 28 29 30 31 32 33 34 35 36 37 | #-*- coding:utf-8 -*-
import cv2
import numpy as np
from matplotlib import pyplot as plt
img = cv2.imread('images/UK.jpg')
img1 = img.copy()
imgray = cv2.cvtColor(img,cv2.COLOR_BGR2GRAY)
ret, thresh = cv2.threshold(imgray,125,255,0)
image, contours, hierachy = cv2.findContours(thresh, cv2.RETR_TREE,cv2.CHAIN_APPROX_SIMPLE)
cnt = contours[14] # 14번째가 지도의 contour line
# 끝점 좌표 찾기
leftmost = tuple(cnt[cnt[:,:,0].argmin()][0])
rightmost = tuple(cnt[cnt[:,:,0].argmax()][0])
topmost = tuple(cnt[cnt[:,:,1].argmin()][0])
bottommost = tuple(cnt[cnt[:,:,1].argmax()][0])
# 좌표 표시하기
cv2.circle(img1,leftmost,20,(0,0,255),-1)
cv2.circle(img1,rightmost,20,(0,0,255),-1)
cv2.circle(img1,topmost,20,(0,0,255),-1)
cv2.circle(img1,bottommost,20,(0,0,255),-1)
img1 = cv2.drawContours(img1, cnt, -1, (255,0,0), 5)
titles = ['Original','Result']
images = [img, img1]
for i in xrange(2):
plt.subplot(1,2,i+1), plt.title(titles[i]), plt.imshow(images[i])
plt.xticks([]), plt.yticks([])
plt.show()
|
Result